Trading Opportunity in Aluminum: Capitalize on the Head and Shoulders Bottom Pattern

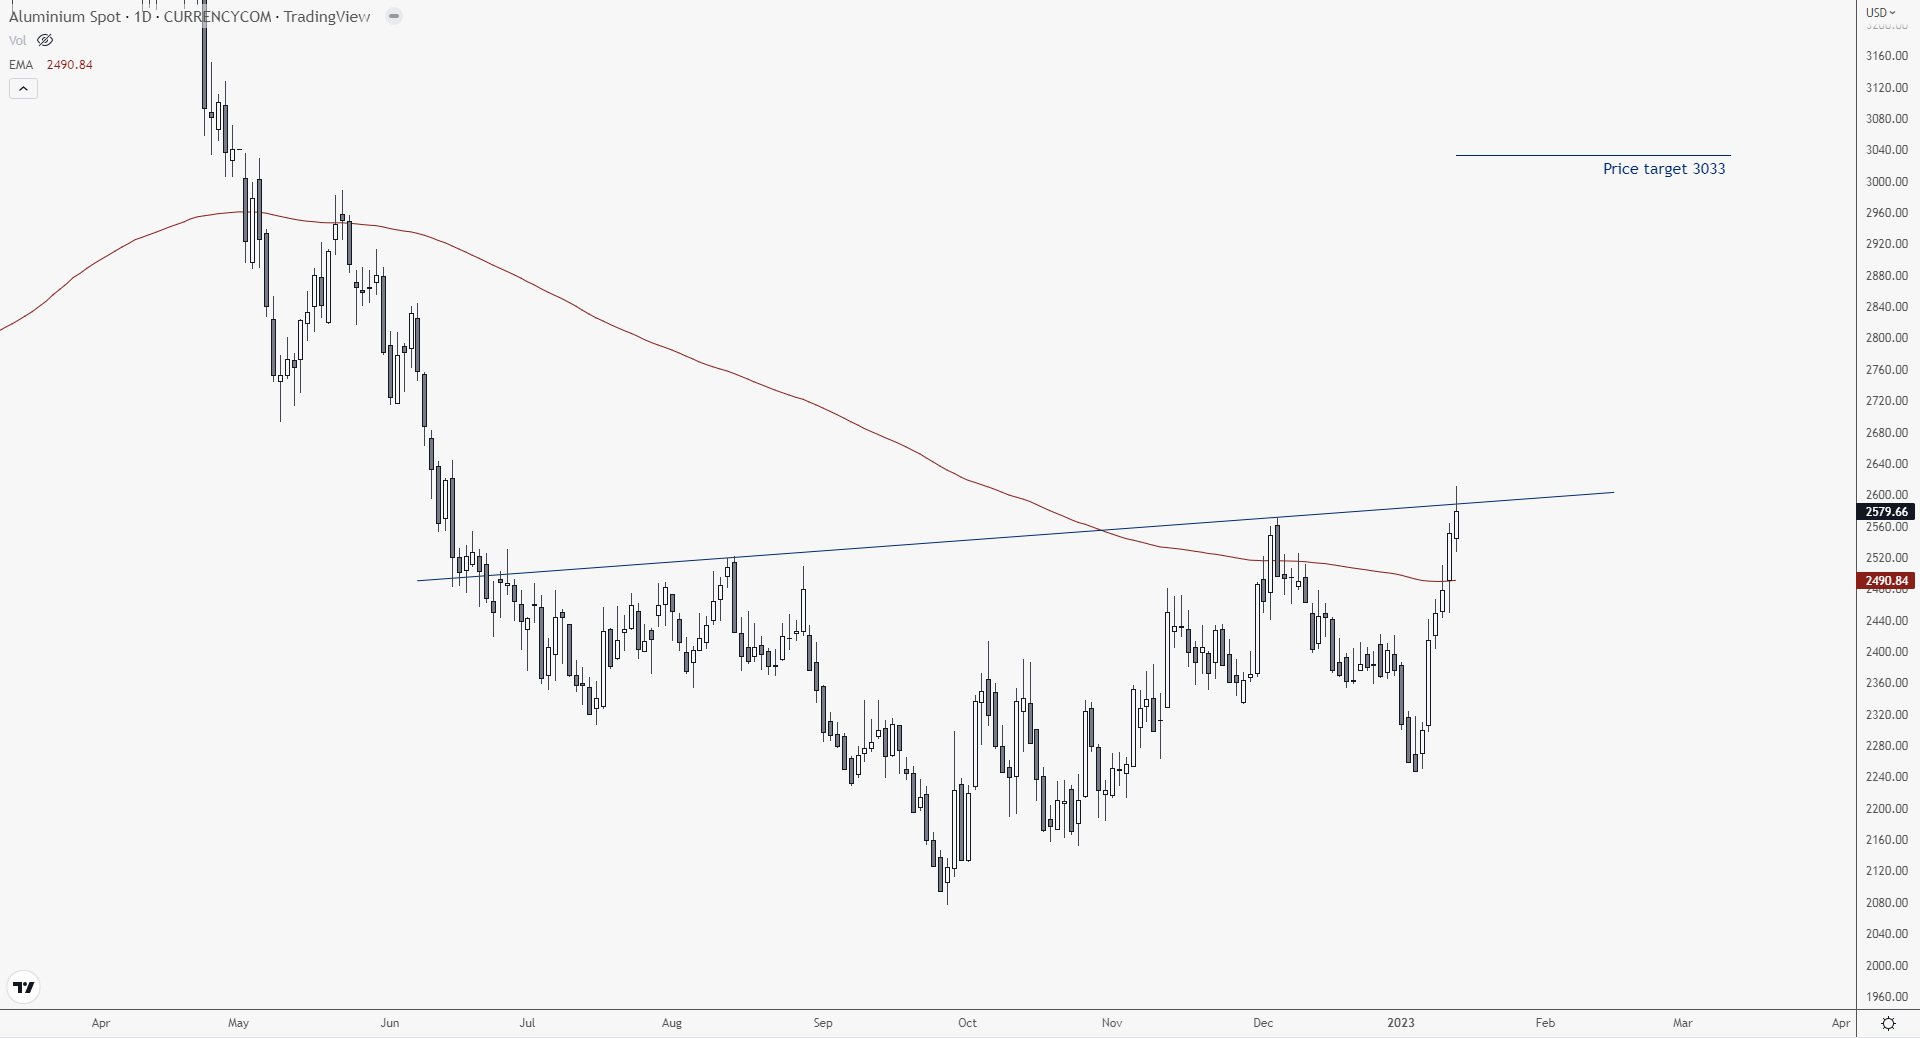
The aluminum market has formed a Head and Shoulders bottom pattern which has been in place for 200 days, offering a great opportunity for traders.
The price bottomed at nearly 2080 in late September 2022 and has been on an upwards trajectory since then. In early December the price topped at 2567 when it touched the 200-day Moving Average (MA), only to drop back to 2244 and form the bottom of the right shoulder. Since then, the price has been going up again. The aluminum price broke above its 200-day Moving Average, which is considered a bullish sign.
Last Friday, the aluminum price rose to touch the necklace of the Head and Shoulder pattern and even break above it. However, in the last few hours of trading, the price retraced and closed slightly below it.
For traders looking to capitalize on this pattern, stop-buy orders should be placed above Friday’s top in order to get activated if the price continues up. According to the pattern’s height, we can expect the price of aluminum to go up by around 20%.
So that means that our price target would be just above 3000 USD. If we put the Fibonacci retracement tool on the chart, from the top in March 2022 to the bottom, we’ll see that the 50 retracement level lies around 3000 – giving us additional confluence for this trade and signifying a great potential trading opportunity to capitalize on.
A stop loss can be placed below the last swing on the 4h chart in order to limit losses.
Follow me on Twitter to get more trading ideas like this one.


