
EURGBP Descending Triangle: A 250 Pips Trading Opportunity
EURGBP has been consolidating in a descending triangle pattern for the last 92 days, with the price fluctuating between the upper and lower boundaries of the pattern. As technical traders and analysts, we can use this pattern to identify potential trading opportunities. In this article, we will analyze the pattern and provide insights on how to trade it to maximize profit potential.
Descending Triangle Pattern
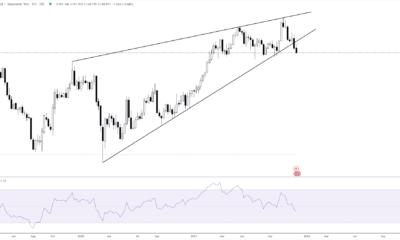
The descending triangle pattern is a bearish pattern that is formed by drawing a horizontal line at the pattern’s low and connecting a series of lower highs with a downward-sloping trendline. The pattern indicates that sellers are gradually gaining control over buyers, and a breakdown is expected. In the case of EURGBP, the pattern’s lower boundary is at 0.87, which has been tested multiple times. Traders should closely monitor the price action around this level as a break below it could trigger a sharp sell-off.
Price Action Analysis
In the last few months, EURGBP has been moving in a range-bound manner, with the price creating lower highs and testing the horizontal support at 0.87 multiple times. On Feb 03, 2023, the pair hit its highest level at 0.895 but quickly reversed to form a lower high at 0.89 on March 07, 2023. Since then, the price has been moving within the descending triangle pattern, with a recent attempt to break above the pattern’s upper boundary. However, the bulls failed to sustain the momentum, and the price formed a bearish pin bar, indicating a potential reversal to the downside.
Trading Opportunities
Based on the descending triangle pattern and price action analysis, we can identify potential trading opportunities. If the price breaks below the horizontal support level of 0.87, it could trigger a sharp sell-off, providing a shorting opportunity for traders. Traders should wait for the daily bar to close below 0.87 before initiating a short position. The 200 EMA also lies around the same level, providing additional confluence to the bearish bias. The target for the short position is 250 pips, based on the pattern’s height.
On the other hand, if the price manages to break above the pattern’s upper boundary and close above the recent local high of 0.884, it could trigger a long position, with a potential target of 250 pips to the upside.

EURGBP – how to trade this descending triangle (click the image)
Risk Management
As with any trading strategy, risk management is crucial. Traders should place a stop loss order above the pattern’s upper boundary for short positions and below the pattern’s lower boundary for long positions. This will limit the potential losses in case of a trend reversal.
Conclusion
EURGBP has been consolidating in a descending triangle pattern for the last 92 days, providing potential trading opportunities for technical traders. The pattern’s lower boundary at 0.87 is a crucial level to watch, and a break below it could trigger a sharp sell-off, providing a shorting opportunity for traders. On the other hand, a break above the pattern’s upper boundary at 0.884 could trigger a long position. Traders should use risk management techniques and closely monitor the price action to maximize profit potential.
Follow me on Twitter and Instagram for more similar trading ideas.

EURGBP Descending Triangle: A 250 Pips Trading Opportunity
EURGBP has been consolidating in a descending triangle pattern for the last 92 days, with the price fluctuating between the...
EURUSD Breaking Through or Rejected by the Symmetrical Triangle? Analyzing the Critical Moment
The EURUSD currency pair is at a critical juncture, as it fast approaches the lower boundary of the huge 275-week...
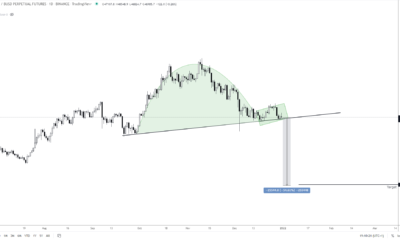
Trading Opportunity in Aluminum: Capitalize on the Head and Shoulders Bottom Pattern
The aluminum market has formed a Head and Shoulders bottom pattern which has been in place for 200 days, offering...
EUR/CHF Looks Set For a Bullish Reversal: How to Take Advantage of the Opportunity
The EUR/CHF forex pair has been in a state of consolidation from July to December. On the daily chart, a...


Head and Shoulders Bottom in CNH/HKD
Currency trading has been particularly volatile for the Chinese Yuan-Hong Kong Dollar (CNH/HKD) currency pair in the past few weeks....


GBP/AUD Cup and Handle
A textbook example of a cup and handle pattern is forming on the weekly GBP/AUD chart. It is an 89-week...


LTC Rectangle Pattern Confirmed: This Is What That Means for Litecoin!
The flagship cryptocurrency, Bitcoin, finally broke below the support line at $45,500 on January the 5th and dragged down the...


Big Falling Wedge Pattern Can Send ICP to THIS Level!
Prolonged price declines in the cryptocurrency market caused very negative sentiment among investors, however, there are some signs of recovery....

Inverted Cup and Handle – BTC May Slump to 21k
December was a big disappointment for all crypto bulls that expected to see Bitcoin at $100,000 and beyond by the...


What’s Next for Bitcoin? Be Patient and Keep it Simple
Simple strategies often beat complex ones, that’s especially true when it comes to trading. After the recent cryptocurrency crash, many...