DXY on Its Way to 103 in a Rectangle Pattern?
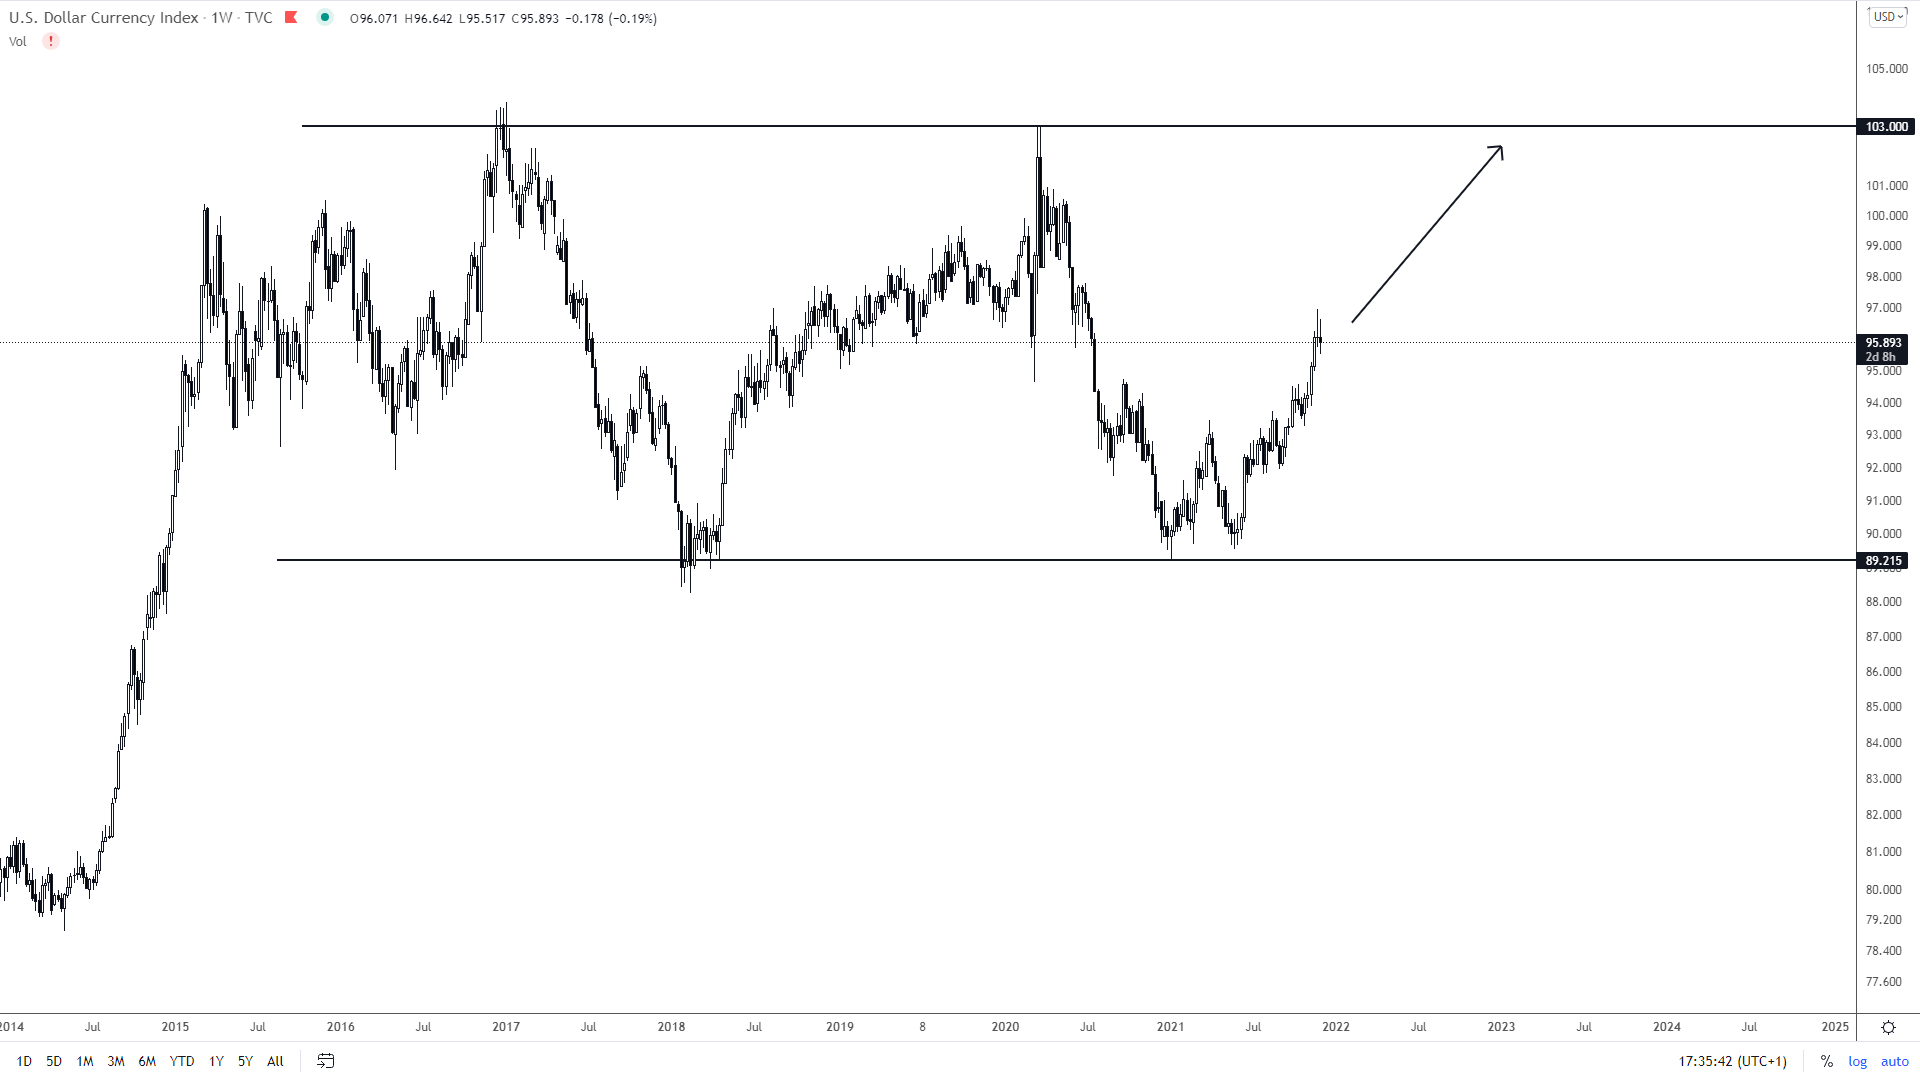
If we look at the weekly chart of the Dollar Index (DXY), we’ll see the price sits midway in the rectangle pattern, just between the support of 90 and the resistance of 103.
DXY came near lows in May this year and has been up for the rest of 2021. The recent sharp rally indicated a move towards 103. However, there is a lot of uncertainty, and Fed’s decisions can change the trend of the index at any moment. But if DXY continues to push higher, toward the upper line of the pattern, the index could reach it before the end of the year 2022.
If this forecast is right, EURUSD is going to tank. How about 88 EUR cents for 1 USD?
In case that you want to trade DXY, you should check Lirunex, a leading broker that allows its users to speculate in several different markets.


