EURUSD Breaking Through or Rejected by the Symmetrical Triangle? Analyzing the Critical Moment
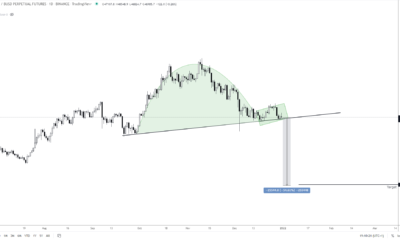
The EURUSD currency pair is at a critical juncture, as it fast approaches the lower boundary of the huge 275-week symmetrical triangle pattern that has never been tested before. This triangle began forming in 2017 and had two tops in 2018 and 2021. The April 2022 breakdown below the lower boundary set off a sharp decline to 0.95 in September of the same year. Since then, the price has recovered in a “V” form and is now heading toward the untouched lower boundary once more.
Analysts are divided on what will happen when the price meets the lower boundary. Some predict that it will be rejected, with the price starting to drop, while others suggest it will break through and continue along its upward trajectory. The triangle’s height indicates a price target of 0.90, although this has never been met. The recent price action of the DXY index further complicates the situation, with the 50% retracement potentially signaling a reversal of the downtrend. This would signify a strengthening of the US dollar, which would lead to a decrease in the value of the Euro against it.
All these factors create an uncertain outlook for the EURUSD pair, and traders must stay alert and prepared to capitalize on any potential opportunities. Whether the pair will reject or break through the lower boundary of the long-term triangle pattern remains to be seen, but one thing is certain – the EURUSD is at a pivotal moment in its current trajectory.
To stay informed and receive more analyses like this one, make sure to follow me on Twitter!


