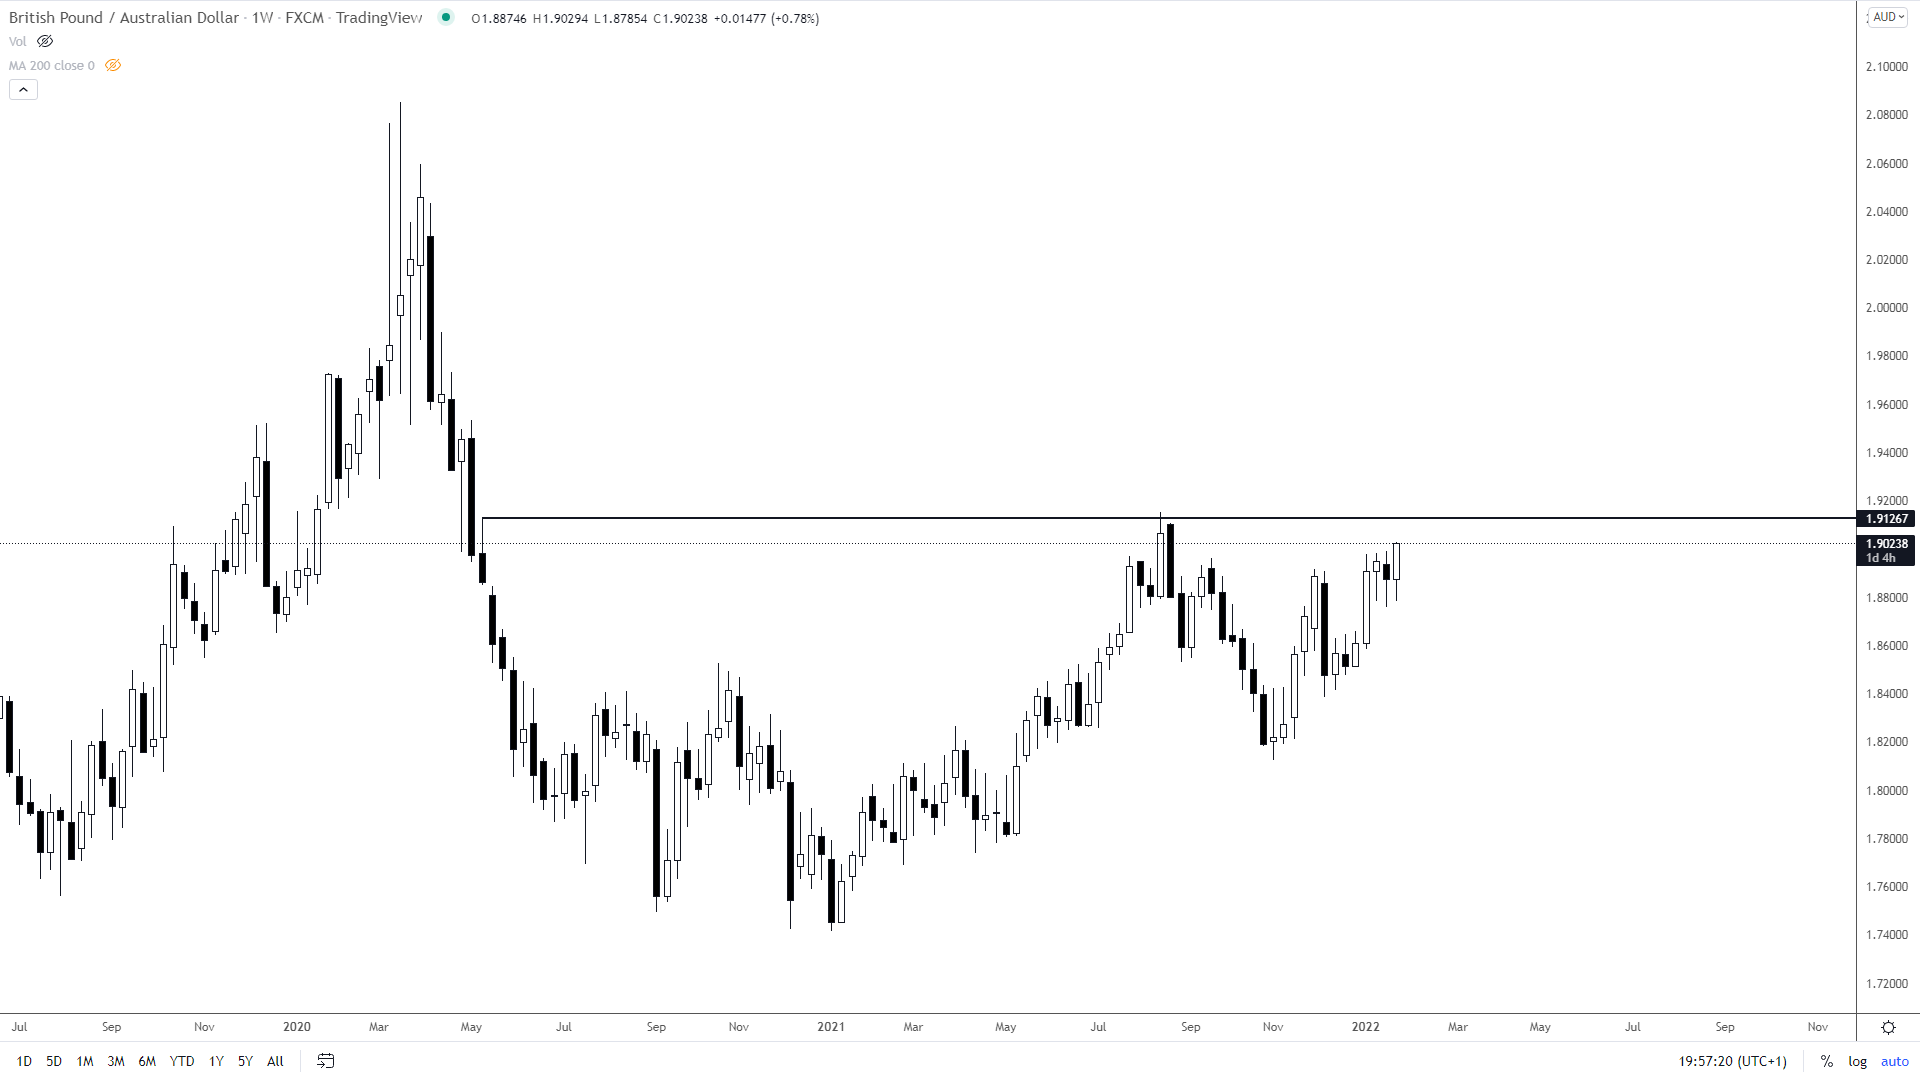
GBP/AUD Cup and Handle
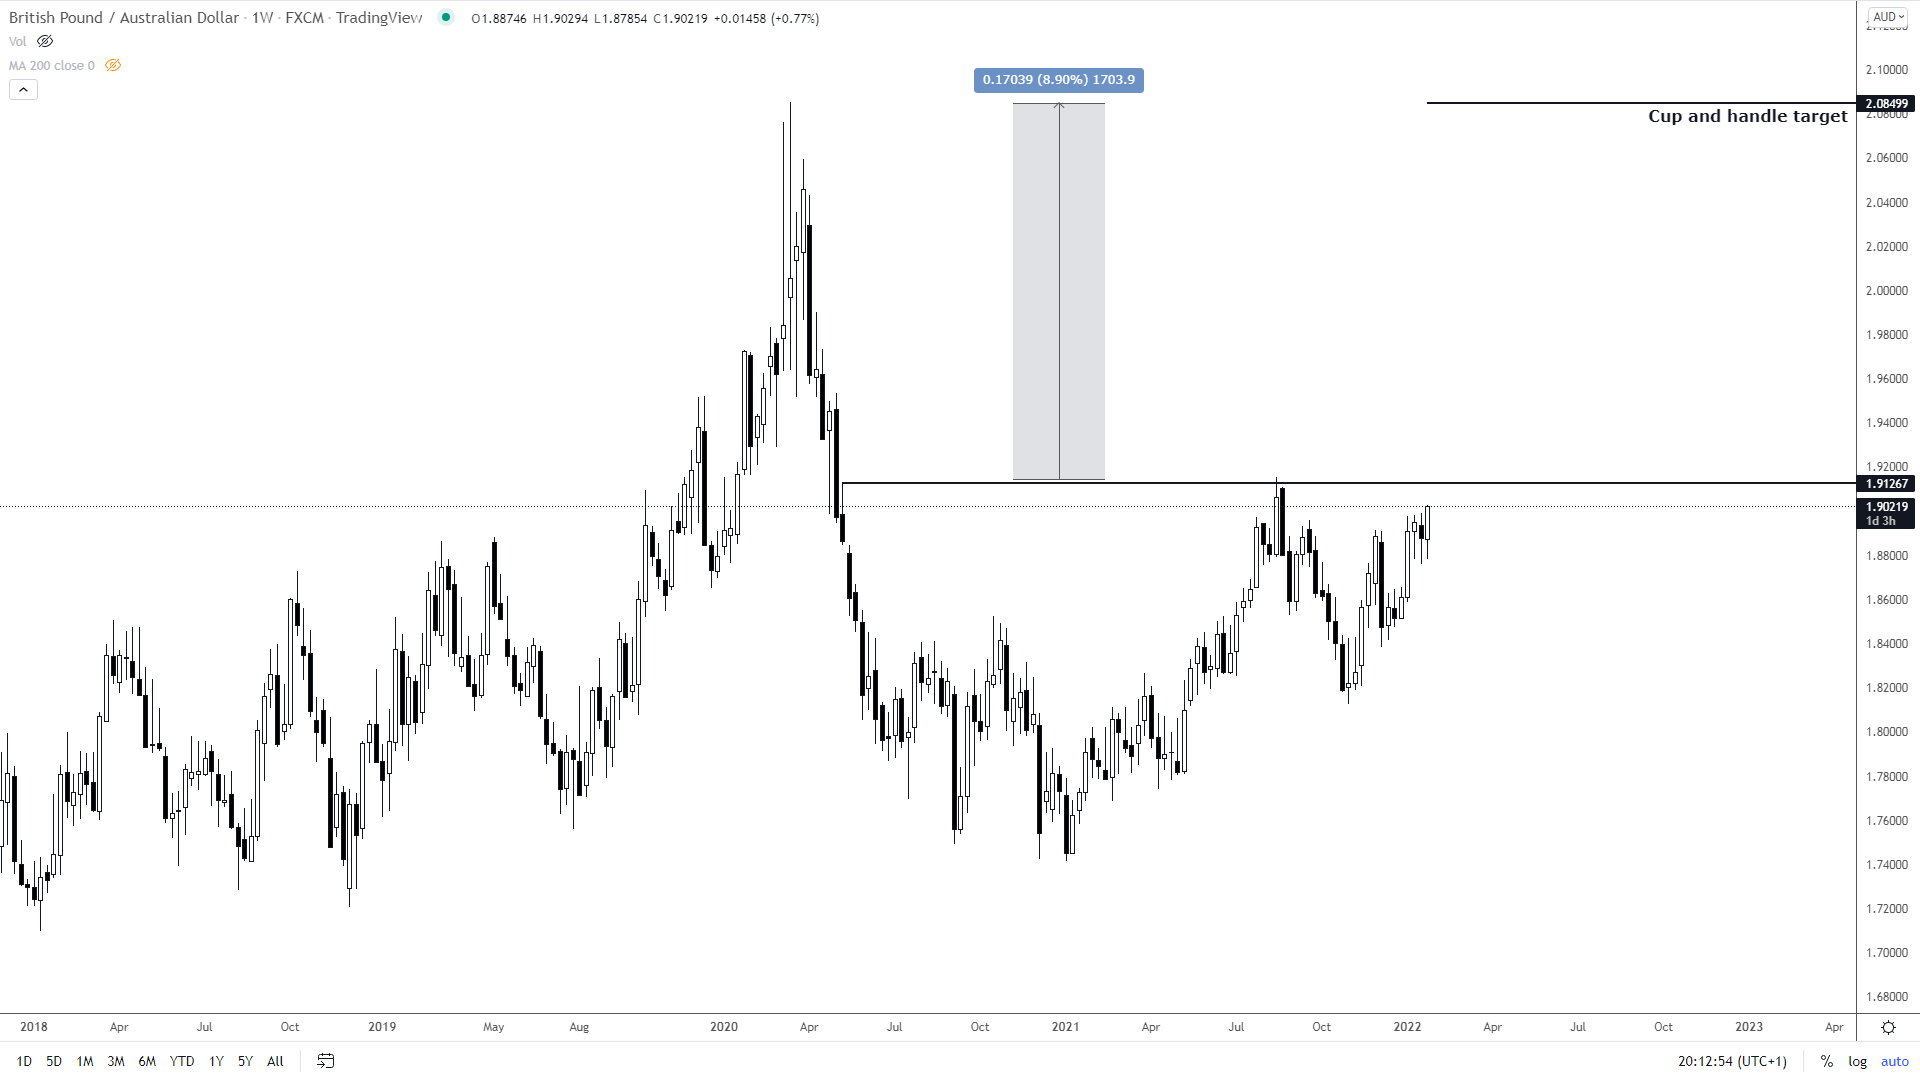
A textbook example of a cup and handle pattern is forming on the weekly GBP/AUD chart. It is an 89-week old pattern, so it should be reliable.
If the price break above the horizontal resistance line we should buy the British pound against the Australian dollar. Protective stop-loss can be placed just below the line, with some room for the price to breathe.
Our target should equal the pattern’s height, which is 2.08 (see the chart below).
Inverse Head and Shoulders Pattern on the Daily Chart
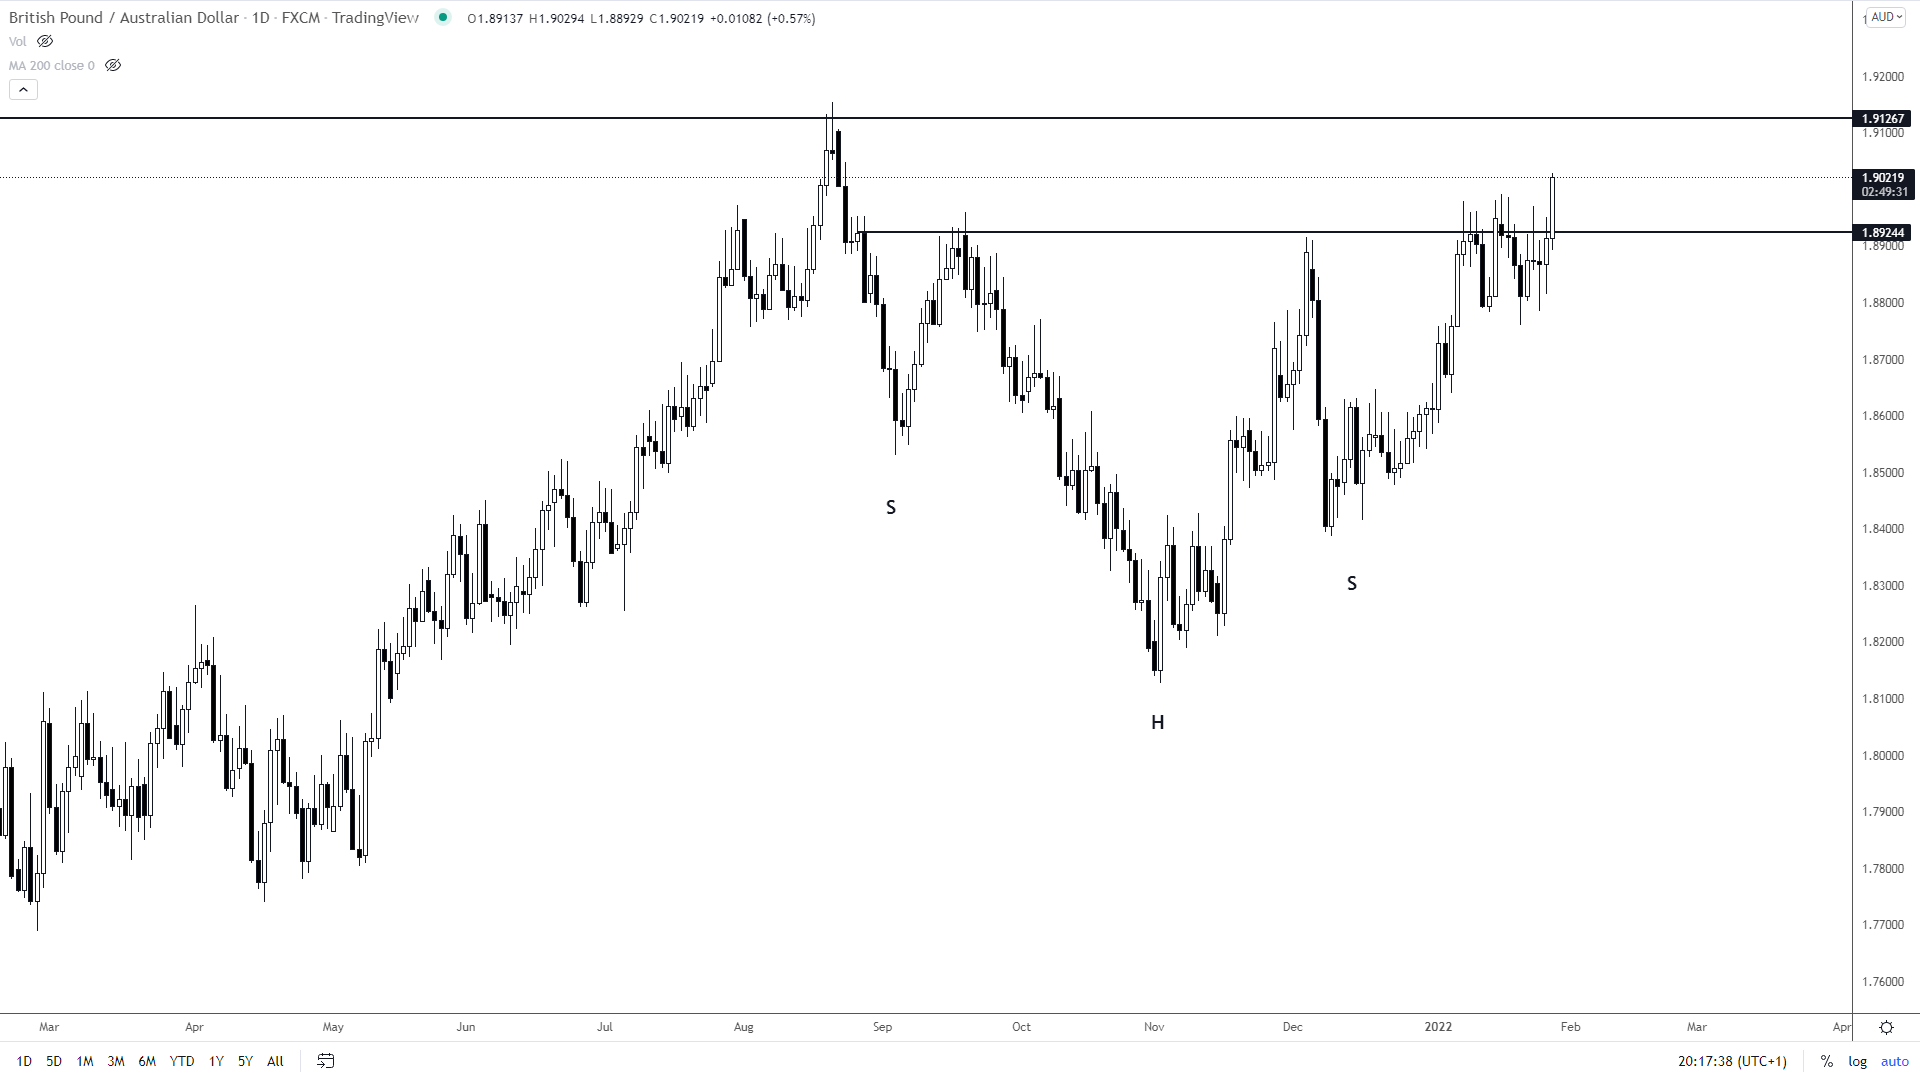
When we switch to the daily chart of this pair, we can spot an inverse head and shoulders pattern.
This smaller pattern within a bigger one gives us confluence. The price already broke above the horizontal neckline and is going toward the resistance line of the bigger, cup and handle pattern.
Let’s wait and see what’s going to happen when/if the price reaches it.


