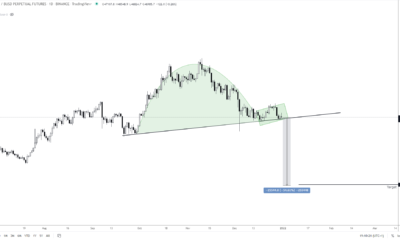
LTC Rectangle Pattern Confirmed: This Is What That Means for Litecoin!
The flagship cryptocurrency, Bitcoin, finally broke below the support line at $45,500 on January the 5th and dragged down the entire market.
Litecoin (LTC) is not an exemption and it broke down through the lower boundary of the rectangle pattern. That means bears won this battle and chances are the ‘Digital Silver’ cryptocurrency will continue to move lower. But how low LTC can go?
Trading a Rectangle Pattern
When it comes to rectangle patterns, everything is pretty clear. All the trader has to do is to wait for a breakout and then to take a position in the direction of the breakout. In this case, we’re going to short LTC. After that just measure the distance between the upper and boundaries to get an idea about the target.
This particular rectangle has a height of 25 (the upper line is at $166, lower at $141, 166-141=25). That means our target for this short LTC trade should be around $116. Stop-loss should be placed above the lower line of the rectangle, + some room to ‘breathe’ ($144 or so).
Follow me on Twitter, Instagram, and Telegram to receive more FREE trading ideas!


